

[ad_1]
ByronOrtizA/iStock via Getty Images
VAMO: an actively managed fund by Meb Faber
The Cambria Value and Momentum ETF (BATS:VAMO) is an actively managed ETF launched on 9/8/2015. It doesn’t track an index, but relies on proprietary quantitative models to select stocks and to implement a hedging methodology. Now, it holds a portfolio of 94 stocks, hedged by a short position in S&P 500 futures and cash equivalents. The fund has $138.09M in assets under management, a 12-month distribution yield of 1.09% and an expense ratio of 0.59%. VAMO features an original strategy mixing market timing, value, and momentum. Portfolio manager Mebane Faber is well-known in the investing world for his enlightening books and white papers.
Literally a Hedged Fund
As described by Cambria, the fund may hedge up to 100% of its long positions in “overvalued and downtrending markets”. “Downtrending” is very likely relative to long moving averages: my guess as a reader of Faber’s work is about 10 months or 200 days. The prospectus suggests that “overvalued” may be defined (at least in part) using the cyclically adjusted price-to-earnings ratio, better known as the “CAPE Shiller P/E ratio.” However, no indication is given about the timing signals and how they are logically combined. What is disclosed is the current list of holdings: long stock positions account for 84.6% of asset value, and the short position in S&P 500 Emini futures is at -83.4%. It seems VAMO’s timing model is in market-neutral mode now.
Stock portfolio
The fund seeks to invest in “the top performing value stocks based on value factors as well as absolute and relative momentum. Value will typically be measured on a longer time horizon (five to ten years) than momentum (typically less than one year).”
U.S.-listed common stocks, preferred stocks, and REITs of small to large market capitalization are all eligible, after passing a liquidity screen. The weight of any sector is capped at 25%. The fund may engage in short sales, but there is no short position in individual stocks at this time. The fund invests almost exclusively in U.S.-based companies (98.4% according to Fidelity).
Energy is the heaviest sector with 40% of the stock portfolio value, or 33.5% of total assets. It is significantly above the theoretical limit of 25%, likely due to recent price action in oil and gas stocks. The next sectors are financials at 21.8% of stock value and materials at 14%. Other sectors are below 6% individually and 18% in aggregate.
Sector breakdown (chart: author; data: Cambria)
VAMO is much cheaper than the S&P 500 (SPY) regarding the usual valuation ratios:
|
VAMO |
SPY |
|
|
Price / Earnings TTM |
5.65 |
20.15 |
|
Price / Book |
1.61 |
3.82 |
|
Price / Sales |
0.58 |
2.4 |
|
Price / Cash Flow |
4.55 |
15.04 |
(data: Fidelity)
Among 94 stocks held by the fund, 6 are risky regarding my metrics. In my ETF reviews, risky stocks are companies with at least 2 red flags: bad Piotroski F-score, negative Return on Assets, unsustainable payout ratio, bad or dubious Altman Z-score, excluding financials and real estate where these metrics are less relevant. Here, they weigh only 5.9% of asset value, which is a good point.
According to my calculations, the aggregate Return on Assets of the portfolio is far above the S&P 500: 12.67% vs. 7.73%. There is no significant difference in Piotroski F-score (5.67). These are my two preferred quality metrics. They point to a portfolio quality superior to the large cap benchmark.
The next chart lists the top 10 holdings with valuation ratios. They represent 13% of asset value. The heaviest position weighs less than 1.5%, so risks related to individual stocks are low.
|
Ticker |
Name |
Weight/assets |
P/E TTM |
P/E proj 2023 |
P/sales |
P/book |
P/net FCF |
Yield% |
|
Loews Corp. |
1.46% |
14.50 |
N/A |
1.00 |
1.01 |
5.44 |
0.43 |
|
|
Ramaco Resources, Inc. |
1.43% |
3.44 |
3.21 |
0.79 |
1.38 |
15.78 |
5.42 |
|
|
Matador Resources Co. |
1.40% |
5.82 |
6.18 |
2.24 |
2.39 |
10.00 |
0.70 |
|
|
Permian Resources Corp. |
1.33% |
5.02 |
3.89 |
1.79 |
1.07 |
5.77 |
2.13 |
|
|
Commercial Metals Co. |
1.32% |
4.90 |
10.86 |
0.66 |
1.79 |
32.20 |
1.31 |
|
|
Sanmina Corp. |
1.28% |
14.29 |
8.79 |
0.44 |
1.88 |
18.17 |
0 |
|
|
Helix Energy Solutions Group, Inc. |
1.25% |
N/A |
25.03 |
1.42 |
0.72 |
49.84 |
0 |
|
|
Steel Dynamics, Inc. |
1.19% |
4.52 |
8.92 |
0.82 |
2.34 |
6.12 |
1.33 |
|
|
TimkenSteel Corp. |
1.16% |
6.49 |
6.90 |
0.59 |
1.15 |
4.69 |
0 |
|
|
The Travelers Cos., Inc. |
1.15% |
13.84 |
12.89 |
1.24 |
2.26 |
7.58 |
1.96 |
Performance
The next chart shows that VAMO has widely underperformed SPY since inception.
VAMO vs. SPY since inception (Portfolio123)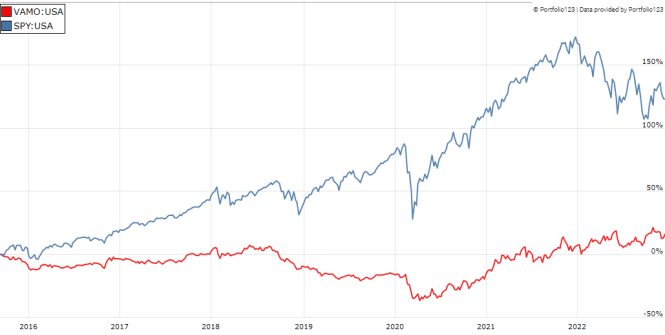
However, the fund has gained almost 10% in 2022 and beats the benchmark by over 27 percentage points.
VAMO vs. SPY in 2022 (Portfolio123)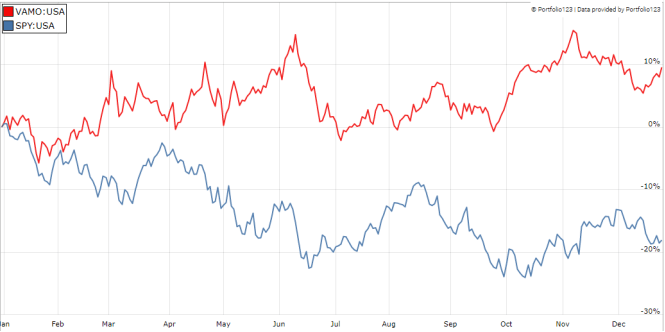
Takeaway
VAMO is an actively managed ETF using quantitative models for hedging and stock picking. It combines market timing, value and momentum. About 40% of the stock portfolio is in energy, and long stock positions are almost entirely hedged by a short position in S&P 500 futures. Valuation and quality metrics are significantly superior to the benchmark. The fund has lagged from 2015 to 2020: this period was difficult for most market timing systems, and also for value investing. However, performance in 2022 is impressive, during a real bear market with a comeback of value style.
[ad_2]
Image and article originally from seekingalpha.com. Read the original article here.